Published colocation benchmarks describe the core markets, and they are one step behind the quotes. Armason sits between operators and the AI cloud providers and offtakers who need capacity, so we see asking rates as operators give them to us, before negotiation. This guide sets those live rates against what published research reports, and explains how density changes what you pay.
Our figures are asking rates held on our capacity map in the first week of November 2026, quoted per kW of contracted IT load per month, with power billed on top unless we say otherwise. They are asks, not signed contract prices, and we do not name operators. Published figures are attributed to their source and stay in the currency they were published in.
The short answer
CBRE puts the average asking rate in primary North American markets at $195.94 per kW per month and London at up to around £170. Across the operators we track, live asks run from £90 to £195 per kW per month in the UK, $150 to $235 in the US and €130 to €200 in Europe. The published figures are a fair guide to the core markets. The spread that matters sits outside them, and it is wider than any single benchmark suggests.
UK: the published ceiling is not the ceiling
CBRE reports that Frankfurt providers now charge up to €225 per kW per month, and maximum pricing in London reaches around £170. On the UK sites we track, London-area and Thames Valley asks run from £135 to £195. Some live asks sit above the published London maximum, and others sit well below it.
Outside the South East the picture changes. The lowest UK asks we hold start at £90 per kW per month, and several sit between £110 and £130. Published benchmarks follow the core markets, so the cheaper capacity, which often comes with more available power, does not appear in them.
Power is billed separately, and it moves the total as much as the rate does. UK electricity quotes on our map range from £0.16 to £0.31 per kWh, with most London-area sites around £0.23. On a 1MW deployment running flat out at a PUE of 1.3, the gap between those two ends is about £1.7 million a year.
US: a wide spread around the benchmark
The CBRE figure is a base capacity rate covering space and rent only, with power and other charges typically additional. On the US sites with a quoted price on our map, asks run from $150 to $235 per kW per month before power. The median is about $178, roughly 9 percent below CBRE’s average, and about three-quarters of the sites sit between $160 and $200. The headline average hides how wide the spread is.
Term moves the number. One New York site is quoted at about $150 to $160 on a ten-year term and $180 to $200 on seven. Power is billed separately at most sites, mostly between $0.05 and $0.16 per kWh. Some sites quote all-in instead, at $180 to $275 per kW with one near $400, which is not comparable with the rest. Some also ask for one to two years paid in advance, or non-recurring charges of $1 million to $1.5 million per MW. A lower headline rate with a large prepayment is not necessarily the cheaper offer.
Europe: asks run from €130 to €200, and scope explains the spread
CBRE expects capacity pricing across Europe’s FLAP-D markets to rise by an average of 12% in 2026. The asks we see across the rest of the continent run from €130 to €200 per kW per month. The Nordics sit at the low end, at €130 to €140 for liquid-ready capacity on a five-year term, with cheap power. A German market is quoted at €130 to €170. New liquid-cooled capacity in Spain is quoted at €150 to €200, take-or-pay per block, and a campus in Italy at €155 to €165 on a five-year term. Power is billed on top in each case.
In Poland, one operator’s range is $120 to $200 per kW per month on a ten-year term. The low end is a building with a grid connection and no data center fit-out. The high end is a fully fitted facility with cooling. Same operator, same country, a spread of about two-thirds, and the difference is scope. Two quotes are only comparable once you know what each one includes.
Low density and high density are different products
Density is what divides the market. Low density is the traditional enterprise rack, roughly 5 to 20kW, in a conventional air-cooled hall. High density is where the cooling is engineered for the load, and it starts lower than many published tables suggest. In our experience, air-cooled halls with rear-door heat exchangers are offered at 30 to 50kW a rack as standard, and air-cooled racks at 60kW and above are practical with the right design.
Direct liquid cooling takes over at around 100kW a rack. The schemes we see are designed for 150kW and up to 230kW. That is the range the newest platforms need: GB200 NVL72 racks are around 125 to 130kW and GB300 NVL72 up to 142kW, both liquid cooled.
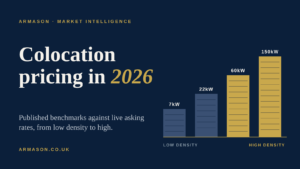
Density changes the rack bill far more than it changes the rate. At £120 per kW per month, before power, a 7kW rack is £840 a month, a 22kW rack is £2,640, a 60kW rack is £7,200 and a 150kW rack is £18,000. A price per rack tells you almost nothing until you know how many kW sit behind it, which is why we convert every quote to a price per kW of contracted power before comparing anything else.
What else moves the price
Term and prepayment come first. Terms run from three years to ten, and some operators ask for a large contribution up front toward site and power infrastructure. Scope comes next: whether the rate covers a fitted hall with cooling, or a shell with a grid connection. Speed matters too. Air-cooled space can usually be stood up faster than liquid-cooled space, because cooling distribution equipment has long lead times.
Underneath all of it is supply. Savills says 96% of the c.66MW due to complete in the UK between the second and fourth quarters of 2026 is already pre-sold, and in North America primary market vacancy fell to a record 1.4% at the end of 2025, according to CBRE. When space is scarce, the operator with capacity available soonest has pricing power.
What is in the quote and what is not
Ask every operator the same questions. Is power included, or passed through at cost? Is liquid cooling in the per-kW rate or a separate line? Is there a ramp, so that you pay only for the capacity you have energised, or do you pay for the full contracted load from day one? What is the minimum term, and what happens at renewal?
Then ask about the items that never appear on a price list: connectivity and cross-connects, remote hands, deposits or bank guarantees, and who pays for fit-out specific to your hardware. These are often where the real difference between two offers sits.
How to compare quotes properly
Put every offer on one basis. Take the total monthly cost including power, cooling and fees, and divide it by the kW you will actually draw once the cluster is running. Compare that, then compare the delivery date, because space that is cheaper but arrives six months later has its own cost. Our cost of compute calculator and GPU cluster planner help you put your own numbers against this.
Armason: neutral introductions between sites, demand and capital
Armason introduces AI cloud providers and offtakers who need capacity to operators who can deliver it, in the US, Europe, the UK and beyond, with no bias towards either side of a transaction. If you are comparing colocation quotes, or hold capacity that can take a dense deployment, we would like to hear from you.
This article is general information. Armason figures are asking rates from operators as at early November 2026 and are not contract prices. Published figures are attributed to their sources. It is not investment or legal advice.
Related reading
· Data centre development costs UK: what projects actually cost to deliver in 2026
· Data centre offtake UK: how demand gets matched to capacity in a constrained market
Sources referenced in this article
· CBRE: European data centre supply surges as growth expands beyond core markets
· CBRE: Data centre capacity pricing in Europe set for double-digit growth
· Inflect: colocation pricing, what to expect in 2026 (citing CBRE)